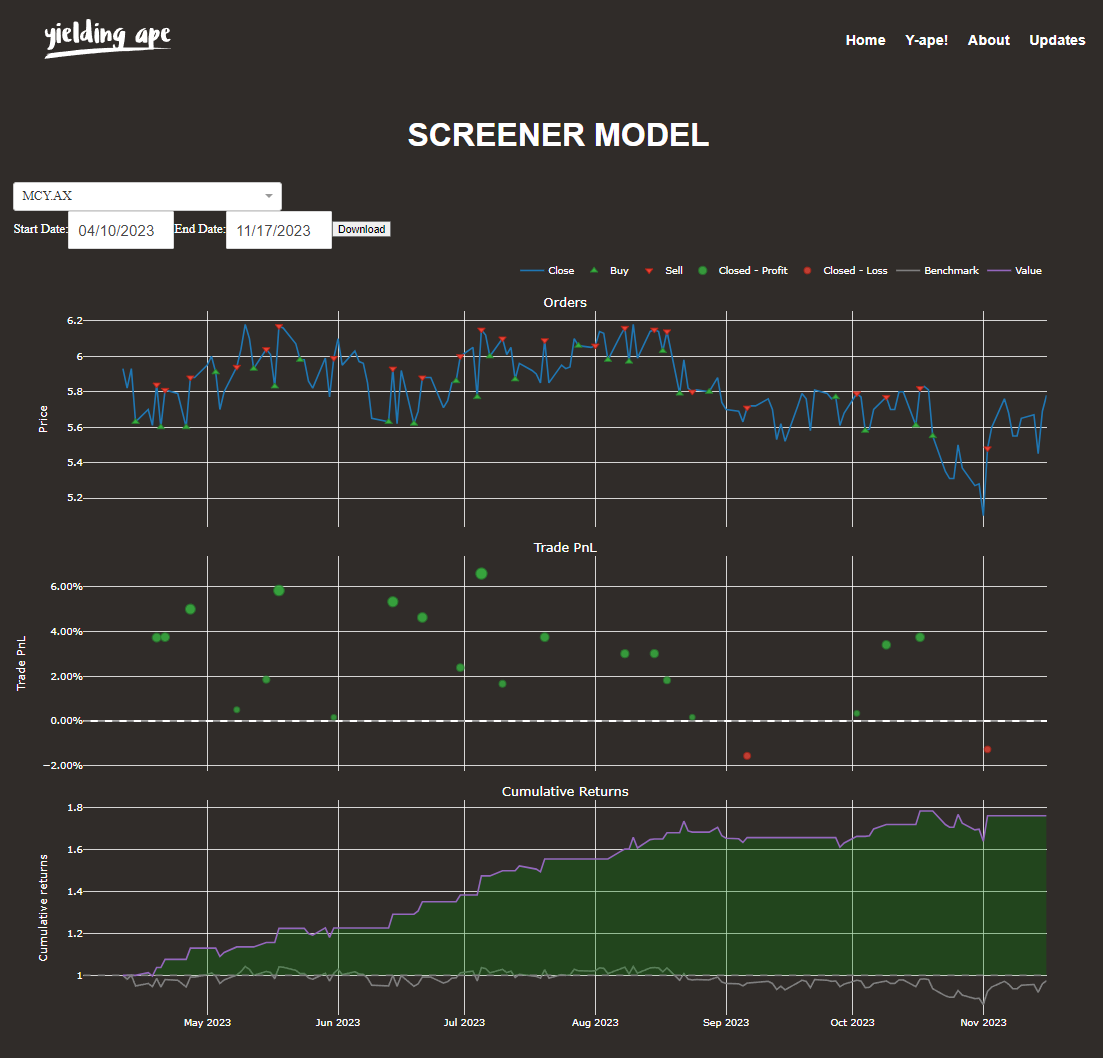
We are thrilled to unveil our latest feature - the 'Screener Model'. This innovative tool is set to transform the way our users interact with the financial markets.
The Screener Model displays real-time buy and sell signals for over 150 stocks, offering users an unparalleled view into the workings of our trading model. Whether you're following blue-chip stocks or exploring emerging markets, our screener provides instant insights into potential investment opportunities.
Now, tracking your favorite stocks has never been easier. The Screener Model allows users to personalize their watchlist, enabling them to monitor the model's decisions on stocks they care about most. This feature is not just about following trends; it's about empowering you with the tools to make informed decisions.
By providing a clear view of buy and sell signals across a wide range of stocks, our model helps demystify the decision-making process in trading. This transparency aims to give users confidence in their investment strategies, backed by data-driven insights from our sophisticated trading algorithms.
As we continue to refine and expand our platform, we are committed to introducing features that add value to your investment experience. The Screener Model is just one step towards a more informed, empowered, and successful trading community.
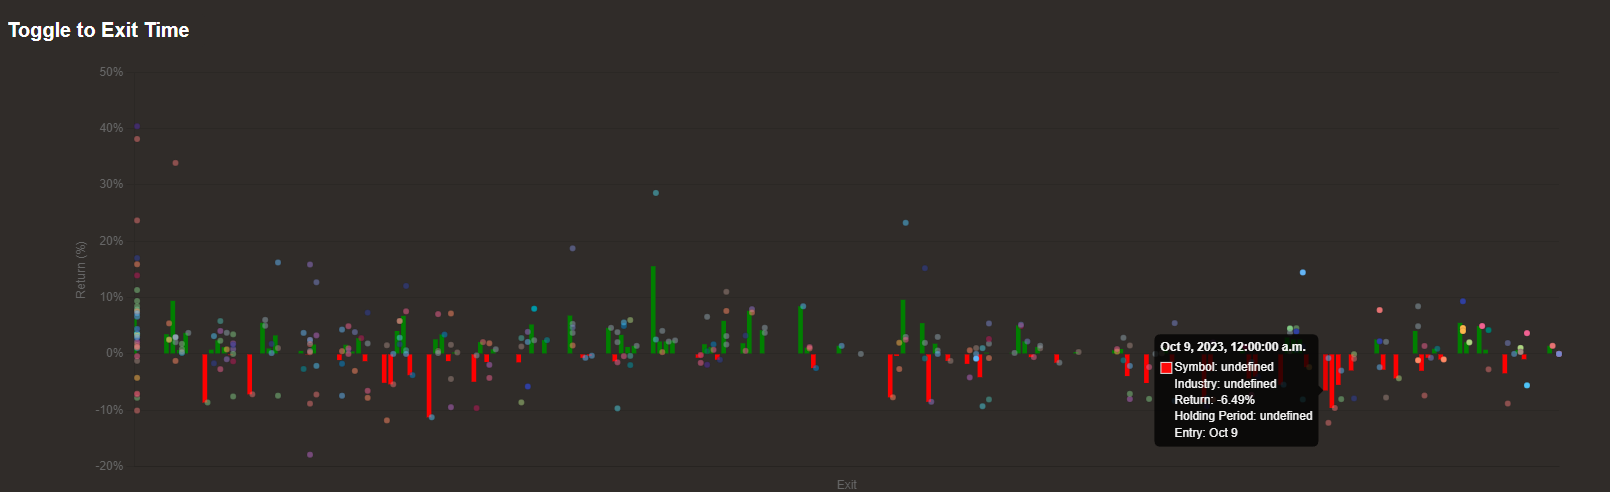
We're excited to announce a significant enhancement to our analytics dashboard: the 'Performance Time Toggle'. This new feature is designed to revolutionize the way you view and analyze our fund's returns.
The Performance Time Toggle allows users to seamlessly switch between viewing returns by exit and entry dates. This functionality is crucial for identifying trends and seasonality in the market, offering a deeper insight into how specific entry and exit timings impact overall performance.
Understanding seasonality in trading can be a game-changer. With this new toggle feature, you can now discern patterns that were previously obscure. For instance, identifying whether certain months yield better returns or if specific industries show recurring performance peaks at particular times of the year.
Looking ahead, we plan to expand this feature to include predictive analytics. Imagine being able to forecast optimal entry and exit points based on historical data and market trends. Our aim is to equip you with tools that not only analyze past performance but also help in making proactive, data-driven decisions for future trades.
This toggle is just the beginning. We're committed to continuously enhancing our platform to provide you with sophisticated tools that empower your investment strategies. Stay tuned for more updates as we further refine our analytics to offer you the best possible insights into the market.
As we navigate another week in the financial markets, we wanted to take a moment to update you on some significant changes and improvements we've made to our trading model.
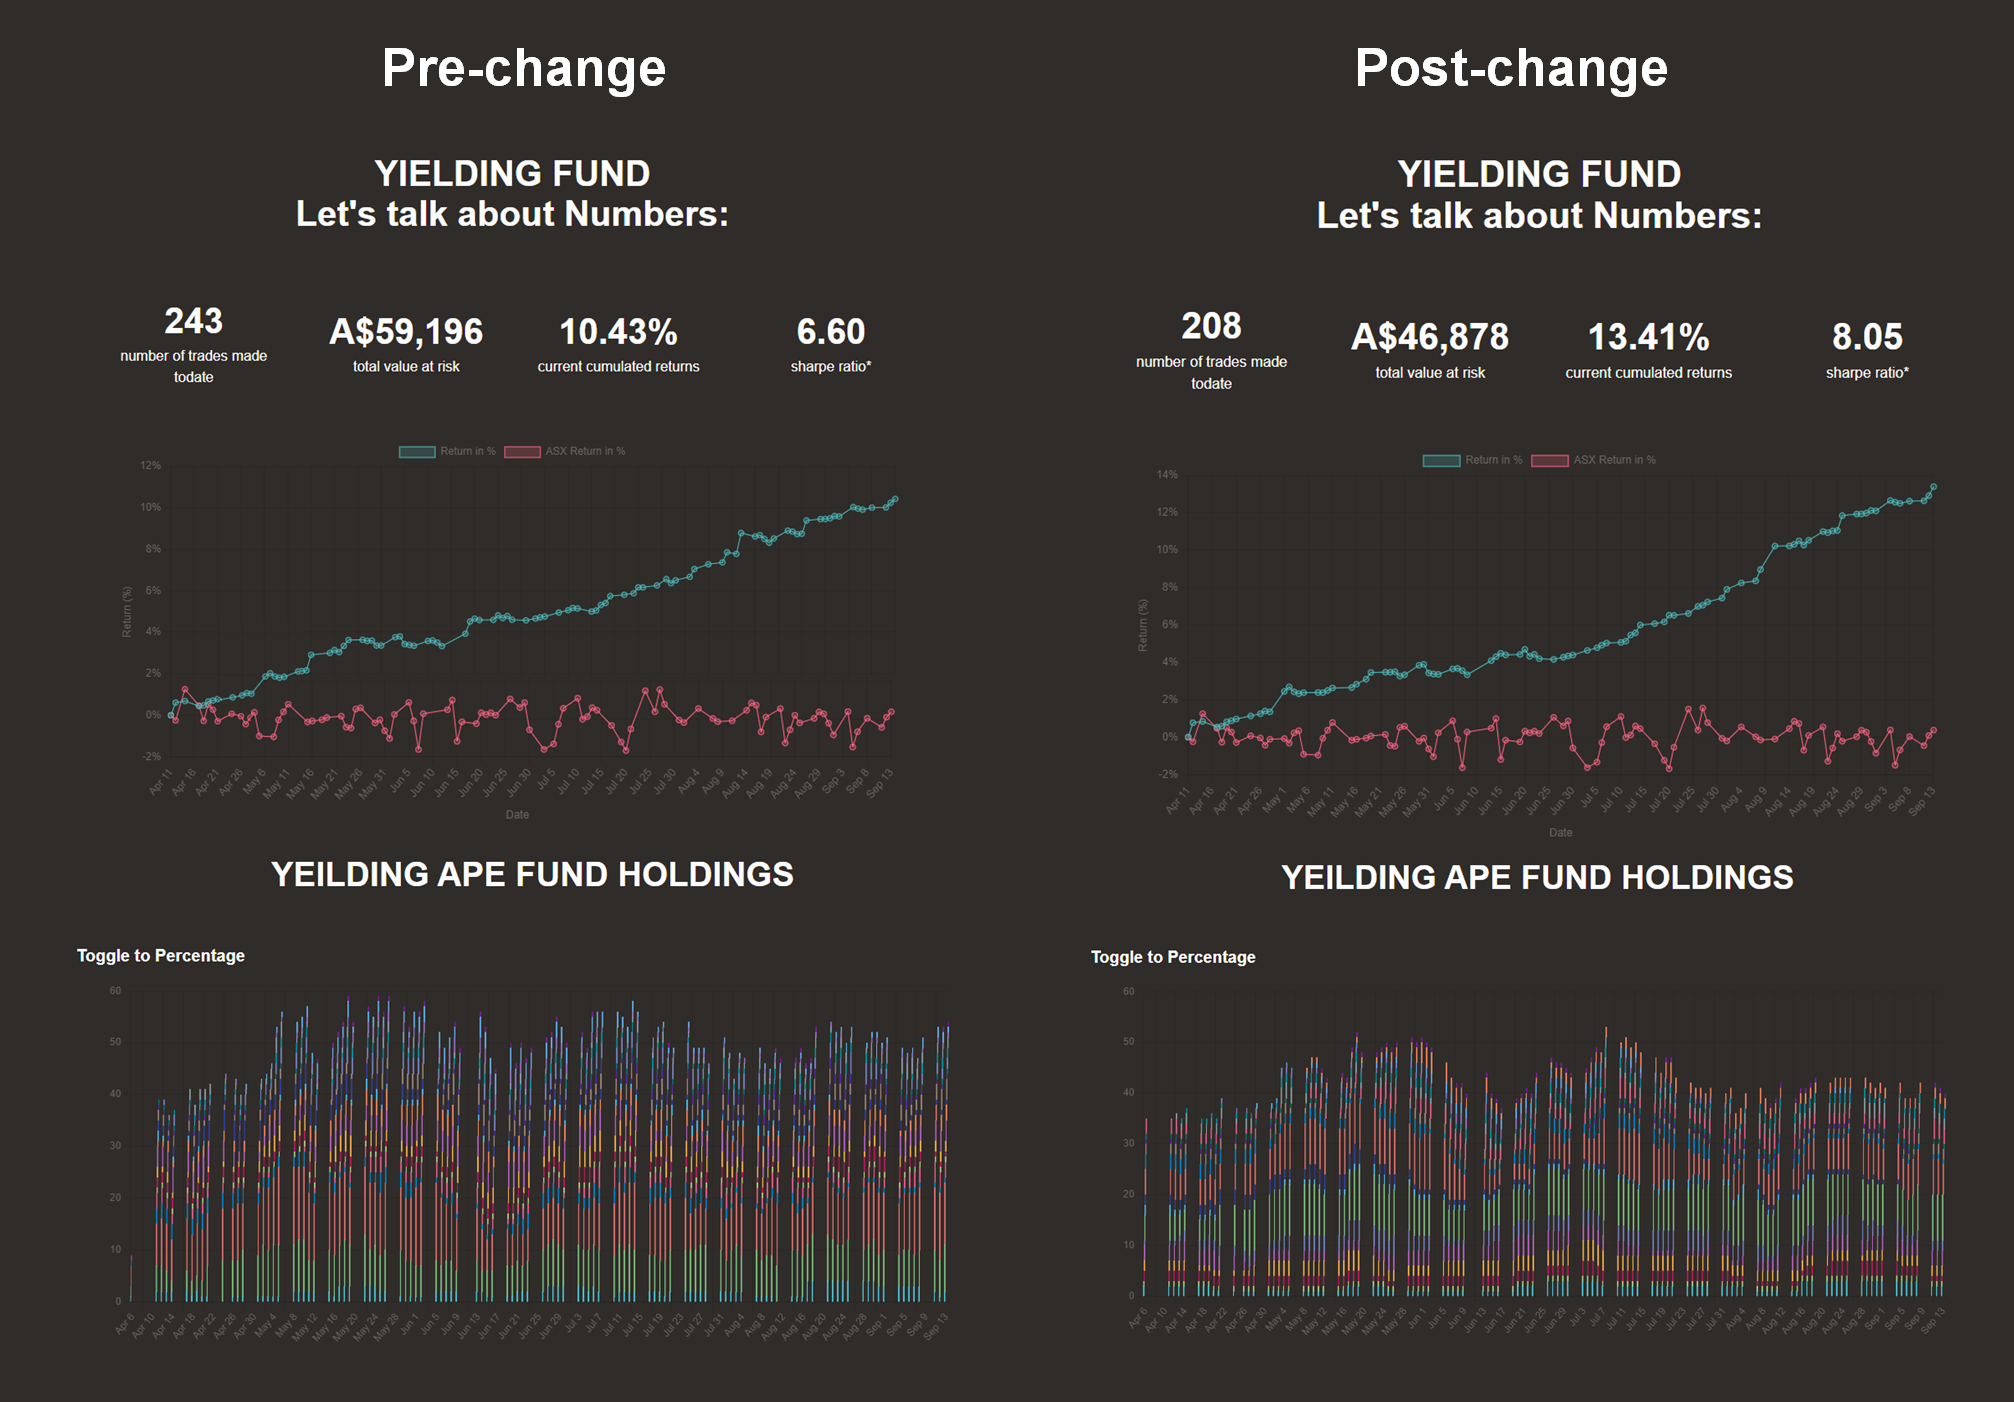
Firstly, you might have noticed a new metric on your dashboards—Sharpe Ratio. We've added this to provide a more comprehensive view of the risk-reward profile of our portfolio. The Sharpe Ratio helps us understand how much excess return we are receiving for the extra volatility that we are taking on by holding a riskier asset.
We've also been working diligently to address some issues with our data source. This is still a work in progress, but rest assured, our team is committed to ensuring the most accurate and up-to-date information for our trading decisions.
The most significant change we've implemented is an overhaul of our overall trading strategy. After a thorough review, we've removed some unnecessary risks from our trades. As a result, we've managed to reduce our portfolio holdings from an average of 50-60 stocks to a more manageable 30-40 stocks.
These changes have yielded immediate results. Our Year-to-Date (YTD) yield has seen a significant boost, going from 10% to an impressive 13%. This demonstrates the effectiveness of our new risk-optimized approach.
The next step in our journey is to make these adjustments more seamless and transparent. We're in the process of automating many of these features to provide you with real-time insights and updates.
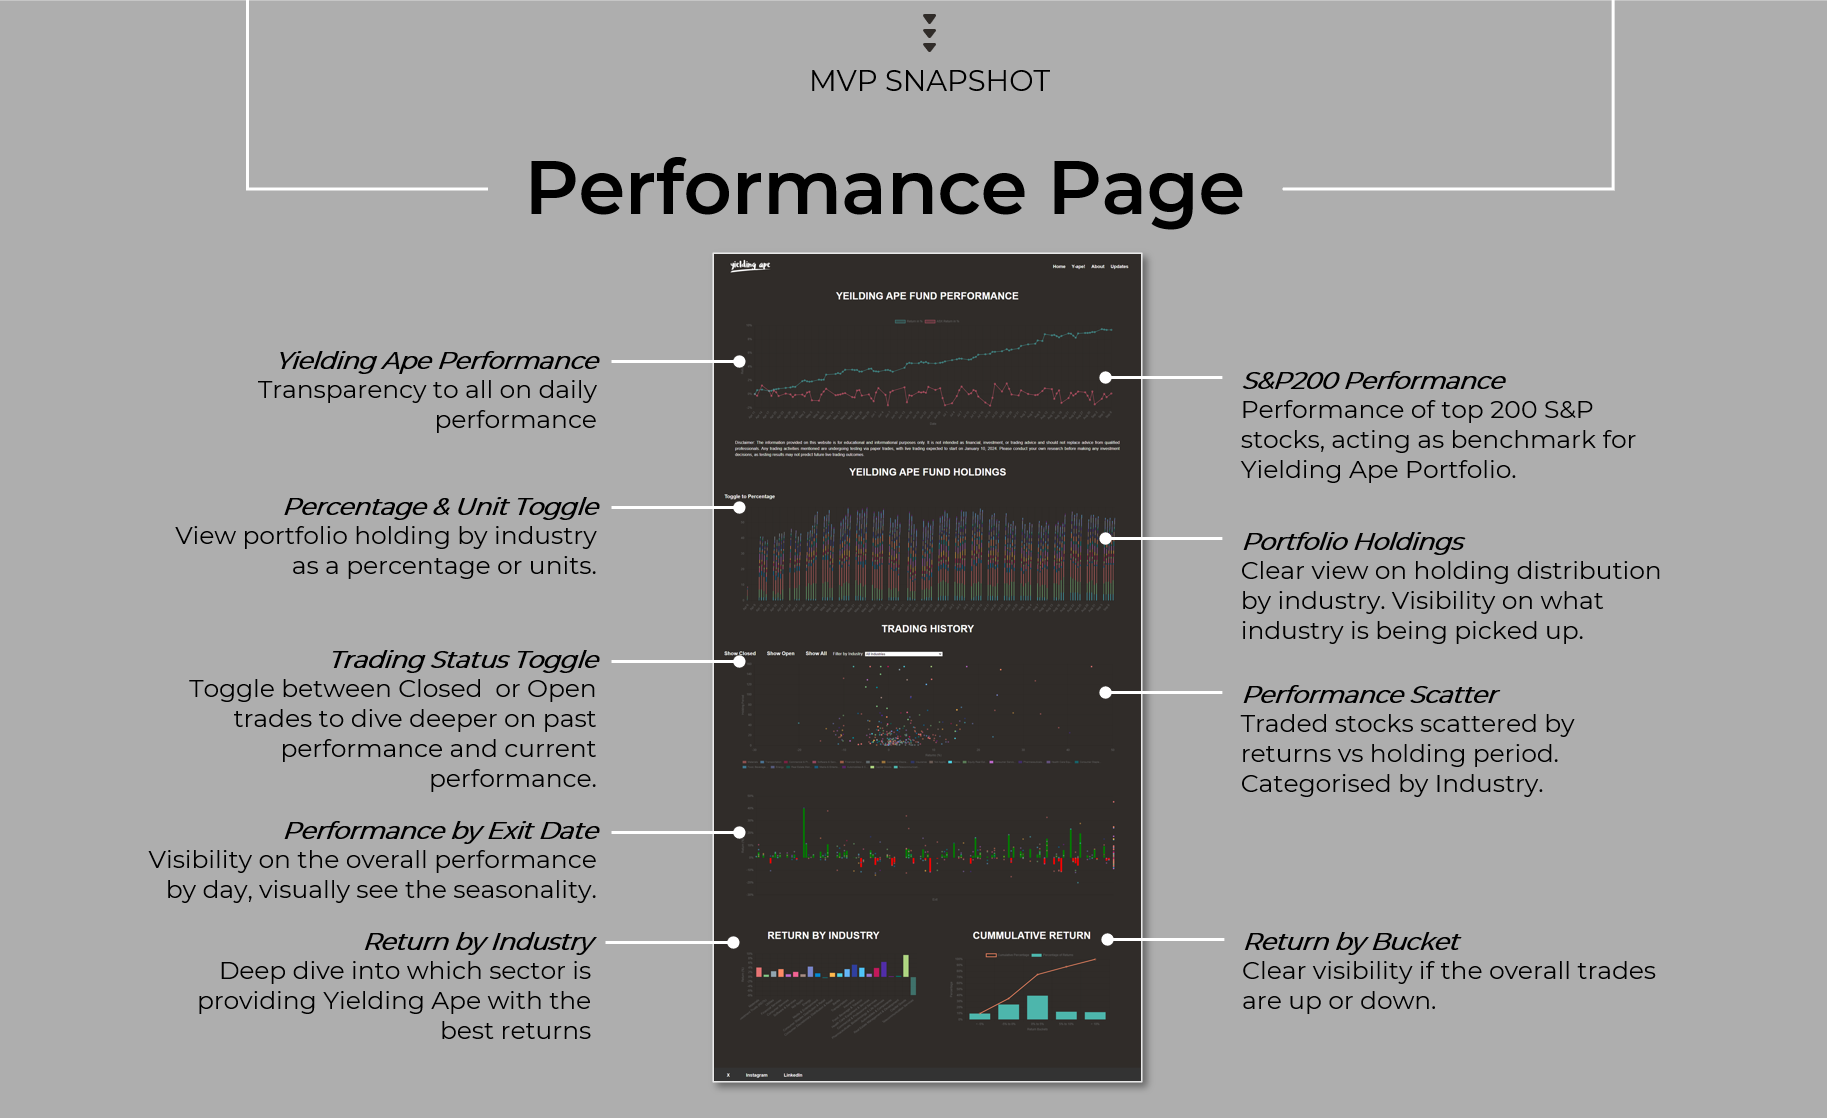
We're thrilled to introduce the revamped performance page, designed to give you an in-depth understanding of Yielding Ape's investment strategies and performance. The new features are aimed at offering a comprehensive view of the fund's behavior over time, allowing users to make more informed investment decisions. Here's what you can look forward to:
Time Series Performance by Exit Date: Monitor the fund’s historical performance with time-series data based on exit dates. This feature provides a retrospective look at how individual investments have fared over time, offering insights into the fund’s decision-making process.
Return by Industry: This feature offers a sectoral breakdown of returns, helping you understand which industries are driving the fund's performance. It's a valuable tool for assessing the fund's expertise in various sectors.
Performance by Bucket: Dive into the fund's performance by categorizing returns into specific percentage ranges, allowing you to easily assess whether the fund is generally trending upwards or downwards. This feature provides a nuanced understanding of the fund's overall success, enabling you to align your investment goals with areas where the fund excels.
These new features offer a 360-degree view of Yielding Ape’s performance, empowering you to make well-informed investment decisions. We hope you find these updates as exciting as we do!
The Yielding Ape Landing Page server is set to go live, offering insights into the present trading performance. Please be aware that we are making daily updates. During the beta phase, definitions might evolve.
Returns Chart, now includes ASX 200 Index Return benchmarked to 2023-04 alongside the performance of the Yielding Ape Fund.
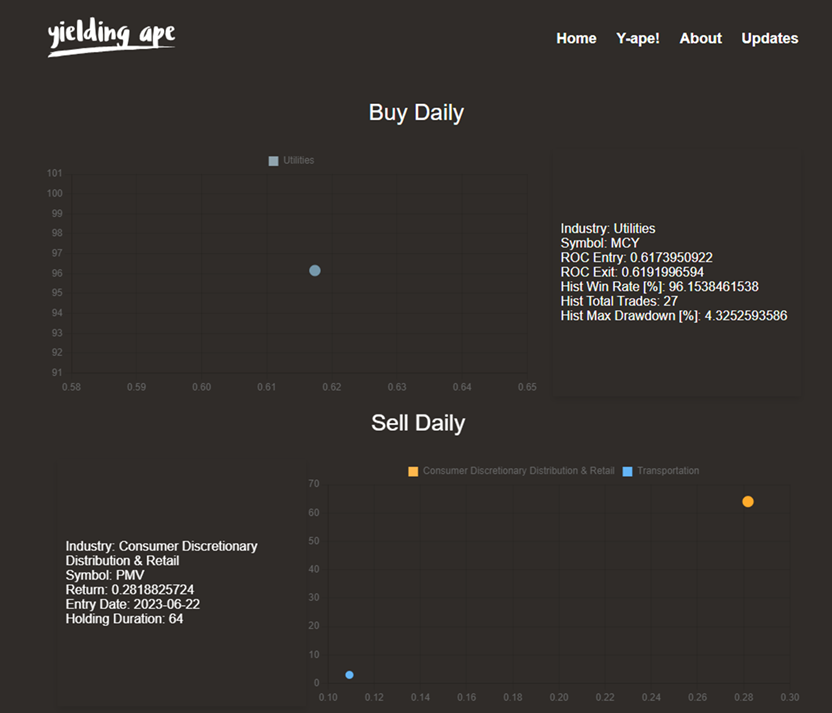
Newest feature to land shortly, daily visibility of Yielding Ape Model Trades to be displayed. Each day the model will spit out buy orders and sell orders from the algorithium. For the buy side it will show the historical win rate, trades made and the max drawdown. For the sell side, it will show the return, entry date and holding period.
\[ c.\text{Return in %} = \frac{c.\text{Return}}{\text{max.VaR} - c.\text{Return}} \]
\[ c.\text{Return in %} = \frac{c.\text{Return}}{\text{max.VaR} } \]
Legend:
c.Return: Cummulative return of portfolio
max.VaR: The maximum position ever taken within the portfolio